
Social media is something I look at every day. It is a big part of my job as an Assistant Director of Athletic Communication at Quinnipiac University, and it is something I enjoy using in my personal life, as well. We see photos, videos, stories and all kinds of digital content on our numerous timelines every day. Let’s analyze an Instagram post to see what goes into posting on social media.
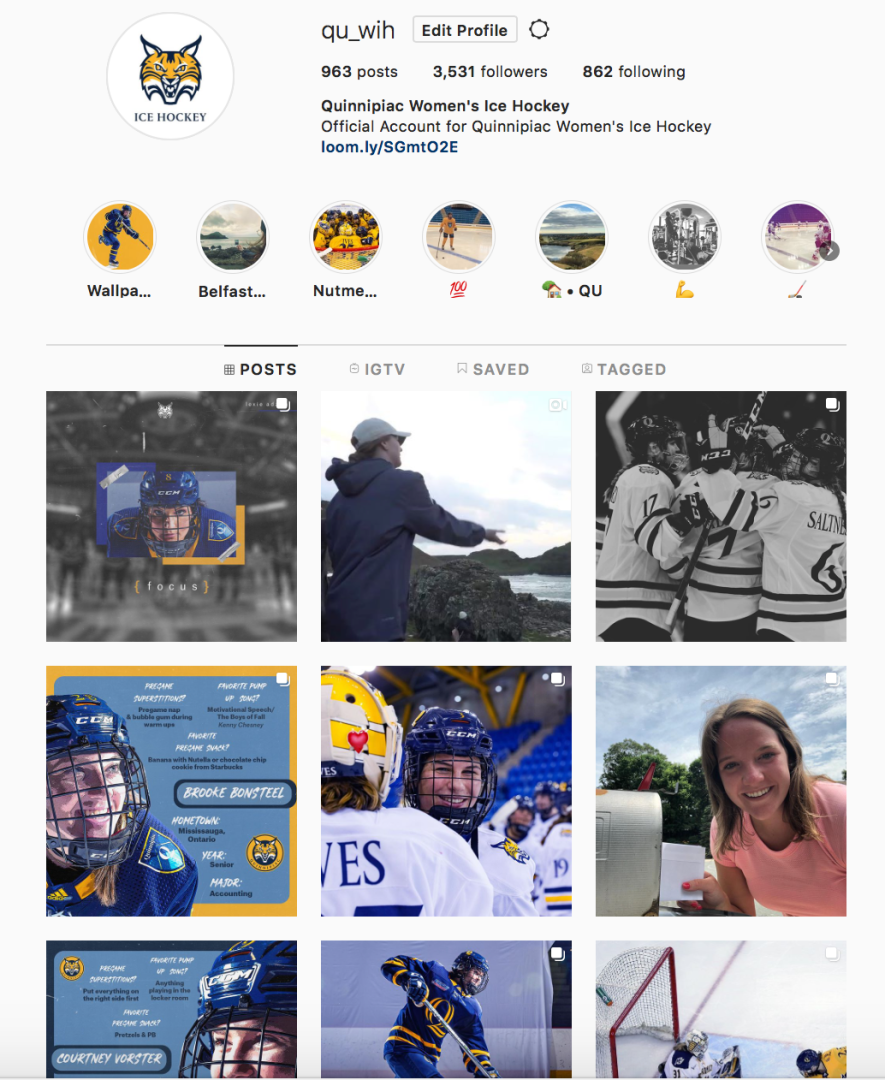
I chose to analyze an Instagram post from an account that I manage at Quinnipiac – the women’s ice hockey team (@QU_WIH). Click here to see the post or see below.
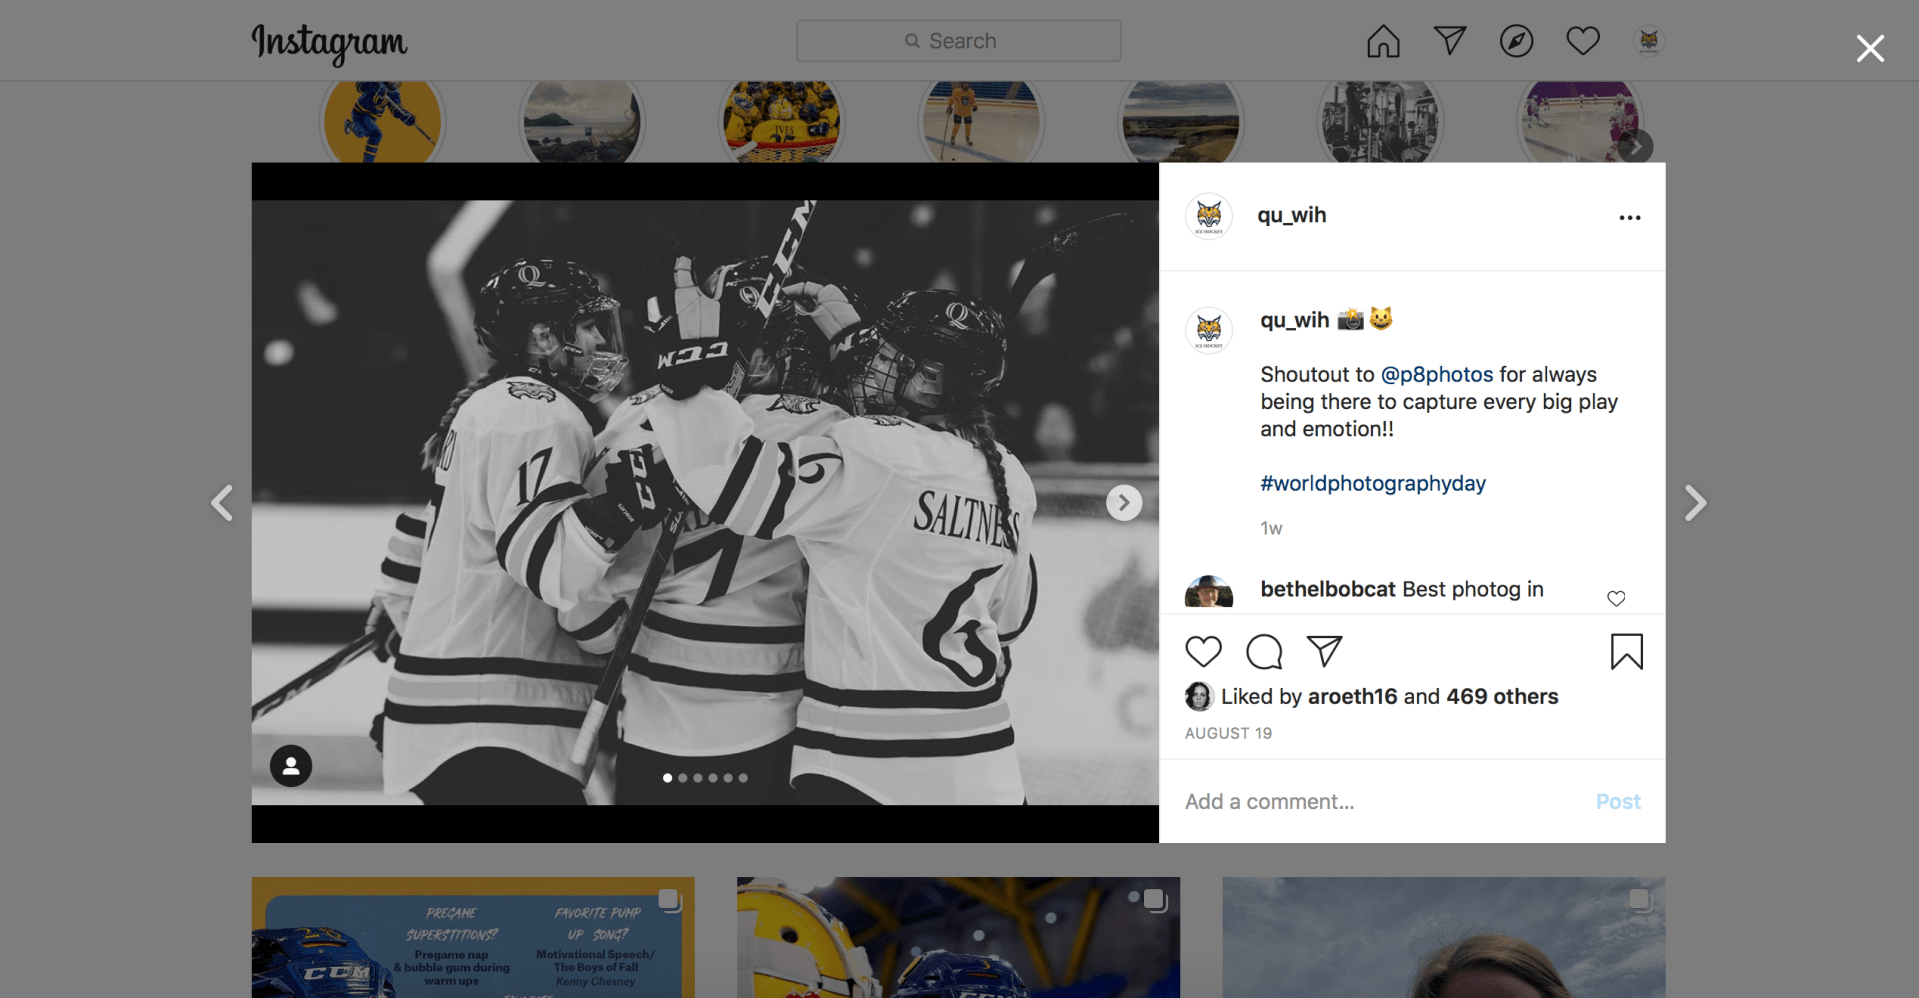
This set of six photos was posted on Aug. 19, 2020 at 4:50 p.m. to celebrate World Photography Day. This post received 470 likes with 2 comments. Eight people reposted the Instagram to their Instagram stories. Thirty-six people visited the QU_WIH profile after viewing this post, and the photos reached 2,231 people. There were over 3,000 impressions on this post.
I have been running this account for two full hockey seasons and over two academic years, so I know a lot about the content that our audience enjoys. This post did very well and was one of the top pieces of content for August on this account.
I believe the time of around 5 p.m. or later is usually a good time to post for this account. When thinking about timing of posts, you want to keep the audience in mind.
Are the ages of the audience all over the place?
Is the audience mostly male or female or mixed?
For QU_WIH, its audience is pretty diverse in terms of age and gender. As the social media manager, I sometimes look to send a message through a post to a specific part of our audience. Most of the time, the target audience is high school-aged females that play hockey. This is the general group of females we are recruiting to play hockey at Quinnipiac.
In addition, the quality and edit style of the photos of the hockey players adds to the value of the post. In my experience, if the photos you are posting are edited well and are unique, the post will perform better.


The caption included a hashtag, which I believe helped the post immensely. #worldphotographyday was a popular hashtag on that day that helped the post reach more people in the explore part of Instagram. Over 200 people saw and engaged with the post from the explore or “other” option, according to my Instagram analytics. Ten percent of the accounts that were reached by this post were not following QU_WIH. This shows how hashtags can help expand the reach of social media posts.
QU_WIH is also a public account. Having a public account rather than a private account helps an account grow quickly and expands the reach of the account and its posts.
As you can see, there is a lot of information that can be found from analytics. From the details in the analytics, the photos and content posted were successful for the QU_WIH account. It reached a wide audience, received a lot of engagement and likes and helped develop the brand.
Explaining Social Media Analytics to the Average Person
Why is social media so important? What is the purpose of deciphering analytics and strategically planning and creating content?
Well, social media is now essential for business, brands, teams and organizations to share messages and communicate with stake-holders and followers. Nowadays, everyone is on a smart phone and perusing content on multiple social media platforms. But, with so many different types of content, audiences and platforms, companies can put a lot of work into social media and end up not seeing any return. In order to work smarter, not harder, companies, businesses, individuals and anyone trying to use social media efficiently, should look into using analytics and research.
Most of the time, throwing a post on social media without any thought behind it proves to be less effective. This is where analytics come in. The details and numbers behind why certain posts do better than others are what analytics are all about.
All social media posts/content are posted at a certain time on a certain day. In addition, all social media content receives views, shares, likes and reposts. These numbers all fall under the umbrella of social media analytics.
For example, a picture is posted on an Instagram account related to a nationally-syndicated network television show at 8 a.m. on the east coast. The photo is a promotion for the TV show’s season two premiere later that night. The account also posts another promotion for the premiere later in the afternoon, closer to the show’s start time. The photo posted at 8 a.m. ET did not do as well on Instagram as the photo posted later that day.
Social media analytics can help determine why. While posting in the morning when people wake up and look at their phones is sometimes a great strategy, in this example it is not as effective. For a national syndicated TV show, you want to have as many eyes on the social media promotion as you can. In the case of the first photo posted, the 8 a.m. posting time is probably too early considering a large part of the audience resides on the west coast, where it would be 5 a.m.
Social media analytics are helpful in situations like these, and for smaller brands and companies time stamps and location are more important. Sometimes, however, trends are not as apparent as something like time changes across the country.
Another example of social media analytics is related to Instagram and the story feature. In my job, I run a collegiate women’s ice hockey social media account, and I have found that many users are more likely to engage with and look at Instagram stories over actual posts. I used analytics of story views compared to likes and comments on posts to determine this.
Social media analytics have eight layers:
Networks – The social media networks provide their own analytics for all users.
Text – Analytics are extracted from the text of posts including comments, tweets, Facebook status, captions and blogs.
Actions – The actions of social media users are analyzed. This includes likes, dislikes, shares, mentions and endorsements.
Search Engines – Analytics are gathered from search engine history, keywords and advertisements.
Location – Social media users’ locations are used in analytics.
Hyperlinks – Analytics use hyperlinks to see what people are clicking on and track incoming and outgoing traffic.
Mobile – Analytics are used with mobile apps to measure users’ experiences and data.
Multimedia – Video, images, audio and animations are involved in the analytics used to measure how multimedia affects users’ experiences.
To analyze your own social media analytics, you can go into the settings of the social media platforms like Facebook, Twitter and Instagram. They all have basic analytics for the normal users to view. If you have a business account, you have the ability to view more analytics, which can be found on each post and in the apps settings.
As you can see, social media analytics covers all of the bases related to social media and how users’ experiences are affected. Likes, shares, retweets, time stamps and so many other details all come together to help social media managers and normal users post successful and engaging content.
